Are you a newbie to the eCommerce world looking for a completed guide to Firebase Analytics? Or are you already in the arena but are struggling to keep up with the competition? Whichever your reason, knowing your customers is extremely important to make your eCommerce store survive in today’s fast-growing world. But how do you do that? The simplest and best way to study your customers’ behavior and grow business is using Firebase Analytics.
In this blog, I’ll run you through the basics of Firebase Analytics – a Guide to Firebase Analytics for beginners.
What is Firebase Analytics?
Firebase is a Backend-as-a-Service provided by Google that keeps a real-time track of your web, android, and iOS applications.
It helps analyze the data of your app or website. In other words, it helps grow the customer base and sales of products using different strategies.
Read on this beginner’s guide to Firebase Analytics to explore the exciting features.
Why do you need Firebase Analytics for your eCommerce site?
Firebase gathers data from all your customers and makes an analytics data graph. The data ranges from the moment a user opens your eCommerce app to the final purchase done.
Firebase gives you an analysis of how your app and website have been performing. On that basis, you can opt for different strategies to target a cohort of audiences and give special discounts and offers only to them. As a result, it will help the user get only relevant information and it increases the probability of the number of sales made.
Advantages and disadvantages of using Firebase
Advantages
Get your data for free!
The best advantage of using a Firebase is that it’s free for most features. The Spark plan of Firebase allows you free access to Analytics, A/B testing, Cloud Messaging, Crashlytics, Predictions, Remote Config, and many more.
You can use up to 5GB of free storage of data and make up to 1000 free calls/month using their Machine Learning Kit.

To check out other free services provided by Firebase, click here.
Saves energy, time and human effort
The extensively long time it takes to record and analyze data using the traditional pen and paper method can be remarkably reduced with the help of Firebase Analytics.
All you have to do now is to observe the data generated in the firebase (automatically), analyze it to understand the behaviour of your customers and improve the numbers using just a few clicks here and there. To sum up, it saves energy, time and human effort! Tadaa!
Analytics of data
A graphical and numerical analysis of your app usage and user behaviour can be made easy using Firebase Analytics.
Firebase Analytics provides unlimited reporting of data for up to 500 events defined using Firebase SDK. Also, you can create custom events that matter to your business and retrieve data. Likewise, you can create informed decisions about how to improve your customer base and keep them happy.
Built-in strategies to improve numbers
Firebase has a number of built-in configurations that you can use. On the basis of the analysis made using the data numbers, you can create strategies to improve user customer base using:
- Cloud Messaging
- Dynamic Links
- Remote Config.
- Firebase Predictions
- Firebase A/B testing
- In-app Messaging
We will discuss each of these strategies in the coming blogs. Stay tuned!
Real-time data update
One of the best features of Firebase includes real-time updates of data. The database of firebase syncs the real-time changes which are reflected in your devices automatically.
The fast and easy loading of content in no time with real and secured data is a huge boon to make the use of Firebase all the more effective.
Cross-platform nature
The cross-platform nature of Firebase allows you to access data of both website and app (Android and iOS). You can get individual data of each platform which gives a better analysis of where and what mode your users are using more to reach out to you.
A combined data and analysis of users can also be retrieved for both app and website giving you an overall idea of your customer base and user engagement. And guess what – this data is free!
Crash reporting and fixing bugs
Firebase gives you the added advantage of reporting issues or bugs for free. The Firebase support team is extremely communicative with an initial response time of 2-3 hours.
One can report bugs/errors using this link.
Disadvantages
Firebase is most definitely ‘close to perfect’ if Google can take care of the few cons that it has –
What happens in Firebase, stays in Firebase!
If you think you can save your data by exporting or downloading it, you’ve got it wrong. It doesn’t matter even if the data belongs to you, Firebase ain’t sharing it with you unless you contact the team.
No room for Closed funnels
Firebase allows the creation of only open funnels. For unknown reasons, closed funnels aren’t Firebase’s area. If you want to filter down the events to see how many final purchases were made by opening a notification, I’m sorry to tell you my friend, but firebase funnels won’t help much. You will have to create another event altogether or figure other ways.
Possible data inconsistencies
Since Firebase supports offline operations, there is a possibility of concurrency of data if one of your customers goes offline and then comes back online resulting in data inconsistencies.
Firebase Analytics features for your eCommerce
This guide to Firebase Analytics intends to introduce you to all the features available in Firebase analytics
Dashboard
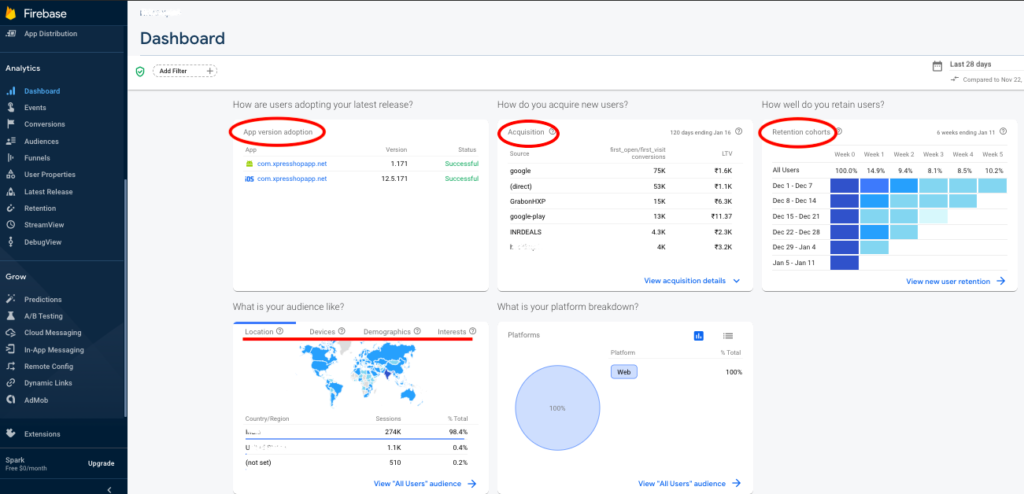
The Analytics tab of Firebase provides a dashboard where you can get the basic information and data of your users.
The dashboard section shows information as below:
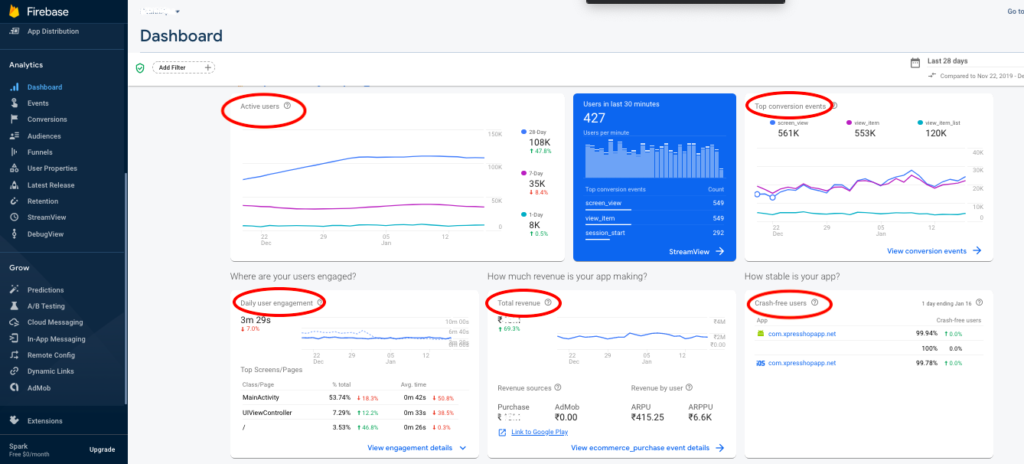
The above-mentioned screenshots describe the data graph for User engagement behaviour.
The information displayed shows the number of active users every minute for the last 30 minutes. In addition, the Firebase dashboard also gives a comparative analysis of the number of active users of the previous day, the last 7 days and the last 28 days.
The dashboard is a summative analytical graph of the user conversion, revenue generated, user engagement, and the retention of the users. You can view this in detail in the subsequent sections of the Analytics tab.
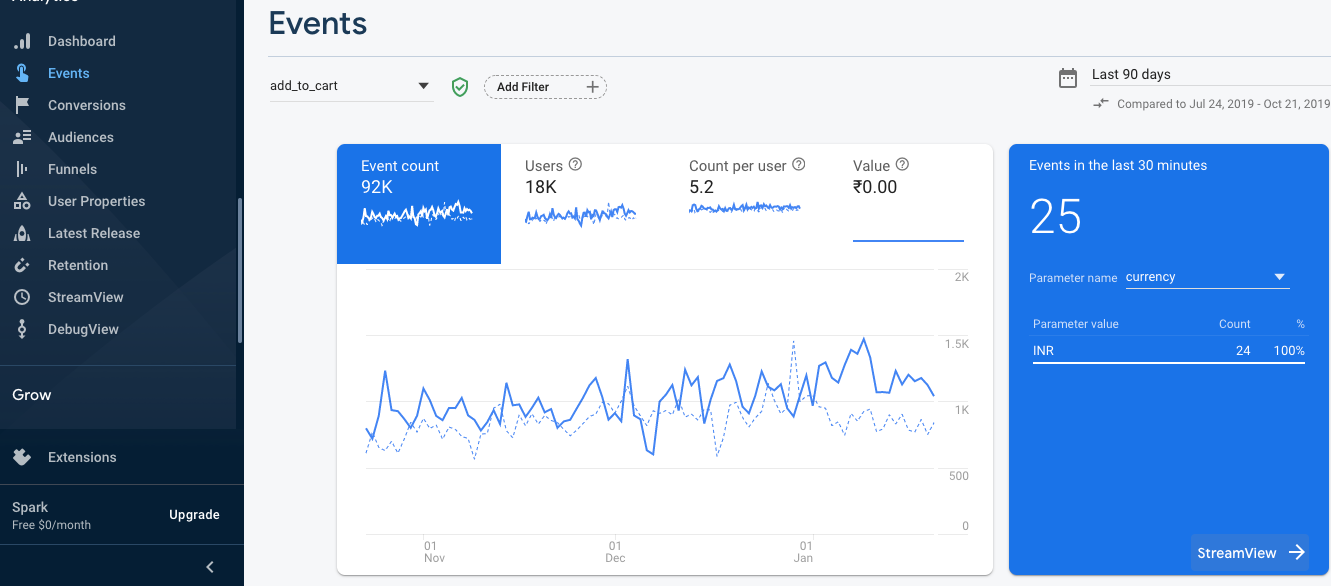
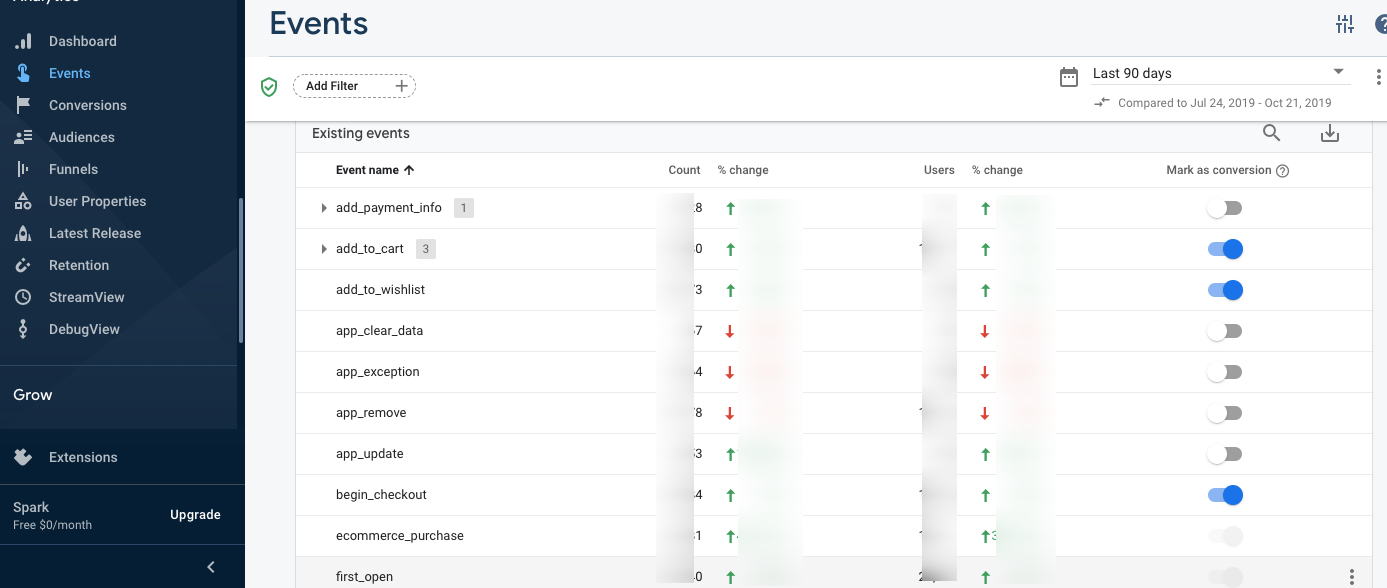
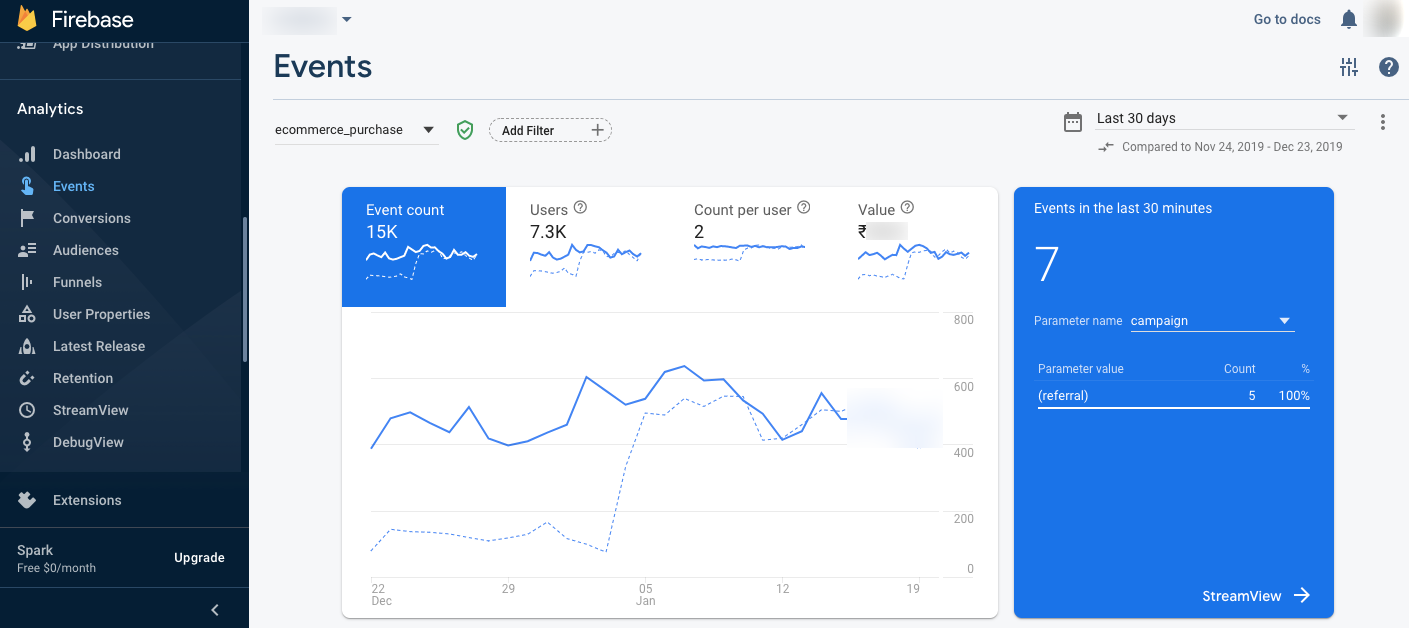
Event Tracking
The Events section in the Analytics tab displays data for every interaction that a particular user makes on the app/website. Each action is counted as an event that tracks the number of users producing it. For example, if a user clicks on the ‘Add to Cart’ button, then it is an event and is stored. The larger the event count, the better it is because you get an idea that ‘n’ number of users have liked your products and thought of buying it.
Each event gives a detailed explanation of how many users have clicked on the ‘Add to Cart’ button how many times, the item that has maximum ‘Add to Cart’ clicks, the price value to buy the product, etc.
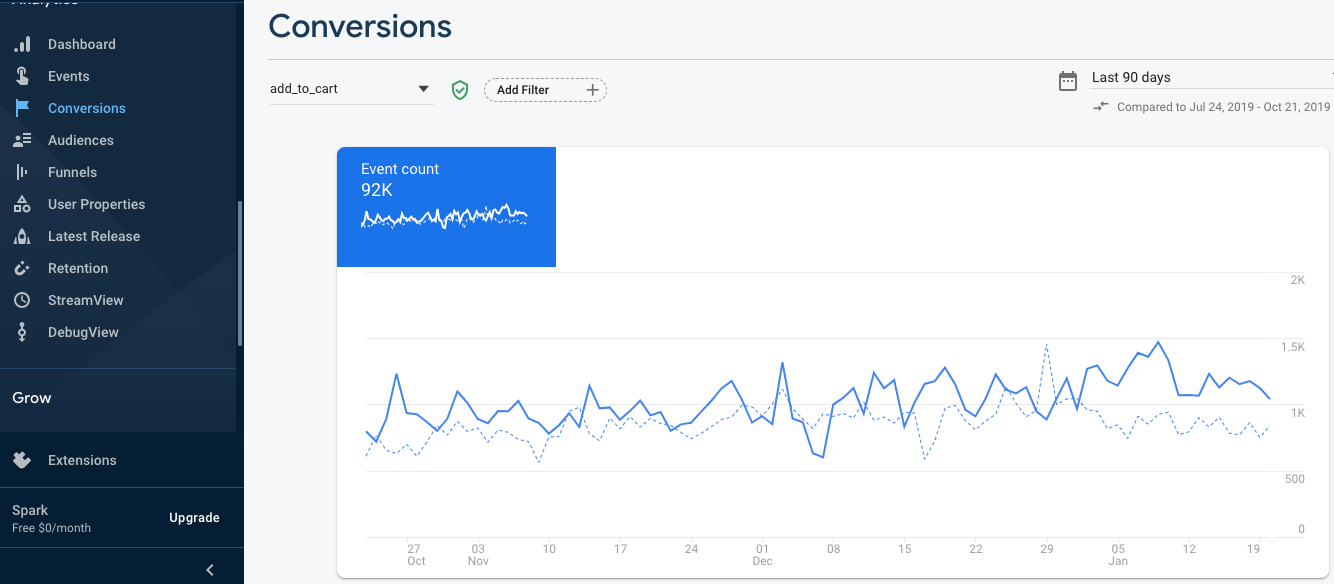
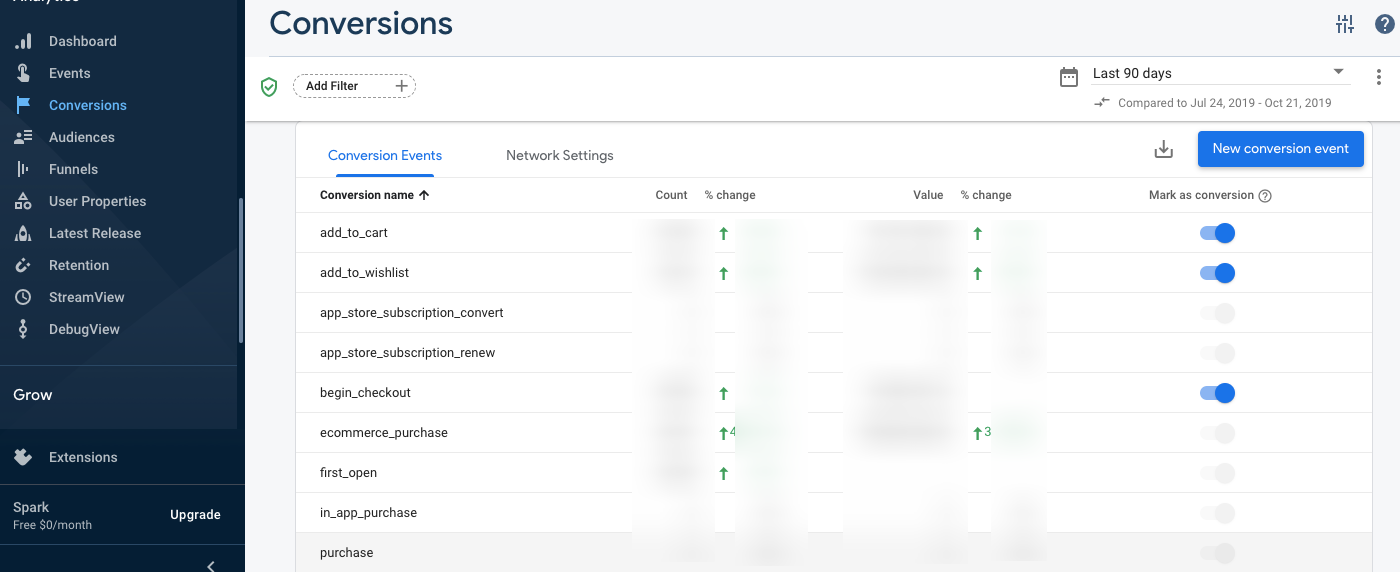
Firebase Conversion Tracking
Firebase Conversion tracking tracks the event count that defines the conversion of users to be your customers. On a general understanding, conversion of users can be defined by events like ‘first_open’ which describes the users installing your app and using it for the first time, or the event ‘ecommerce_purchase’ that describes the number of users that have bought a product from your eCommerce store.
Revenue Generation
The value of revenue generated is calculated using the event ecommerce_purchase. The revenue generated can be displayed according to the currency of your preference.
Filters
Filters give you the liberty to understand and categorize your business according to a particular region, gender, platform, audience, age, device model, etc. This helps you understand what cohort of users are really useful for your business and where you must channelize your efforts for better output.
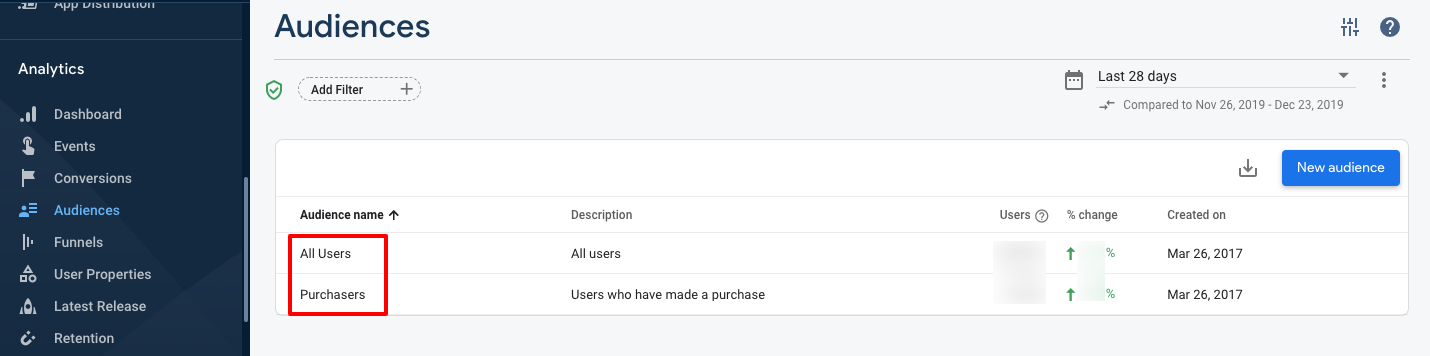
Audience
Similarly, you can categorize your audience on the basis of your need that suits your business. While dealing with the targeted audience, you can prioritize for ease of dealing.
As given in the screenshot below, you can categorize the audience on the basis of normal users and the users who have made a purchase. Consequently, you can find further details about the cohort of users by clicking on the audience’s name.
Funnels
A funnel is used to channelize the number of users who have followed certain steps to complete a task. However, one can only create Open Funnels in Firebase. Open funnels are funnels that allow the users to enter at any stage.
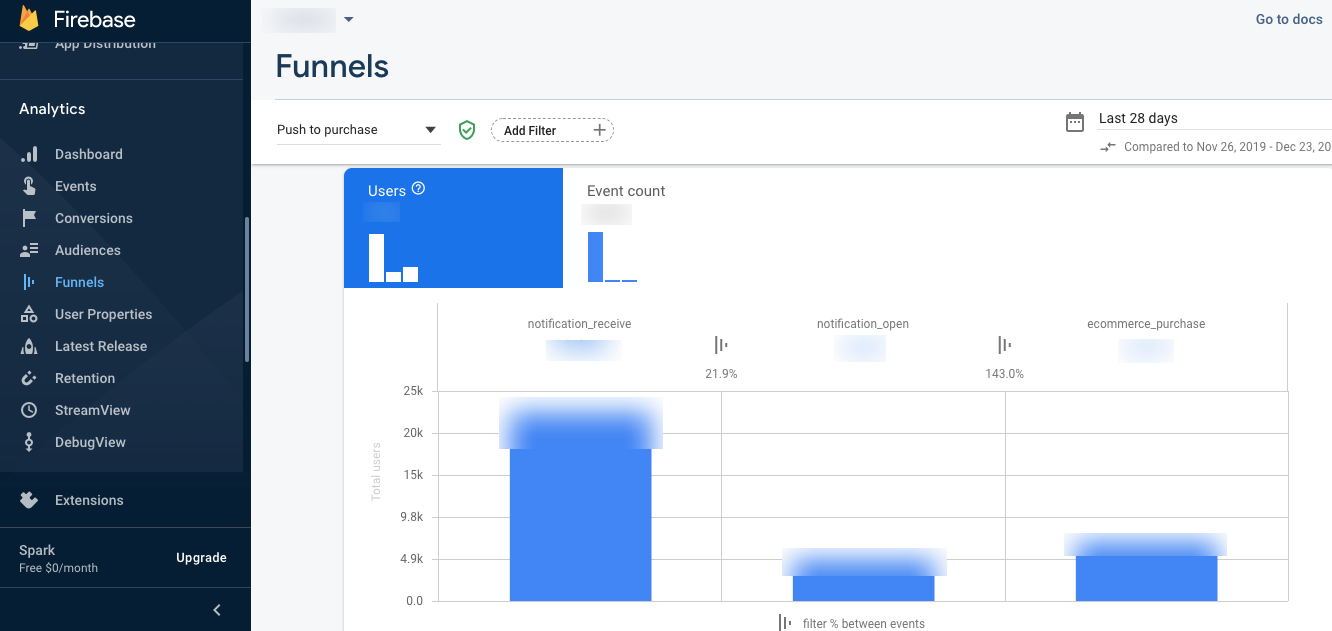
For example, the screenshot above shows a funnel for ‘Push to Purchase’, describing the number of users who received a push notification, opened it and then made a purchase. All these events performed must be in the exact order.
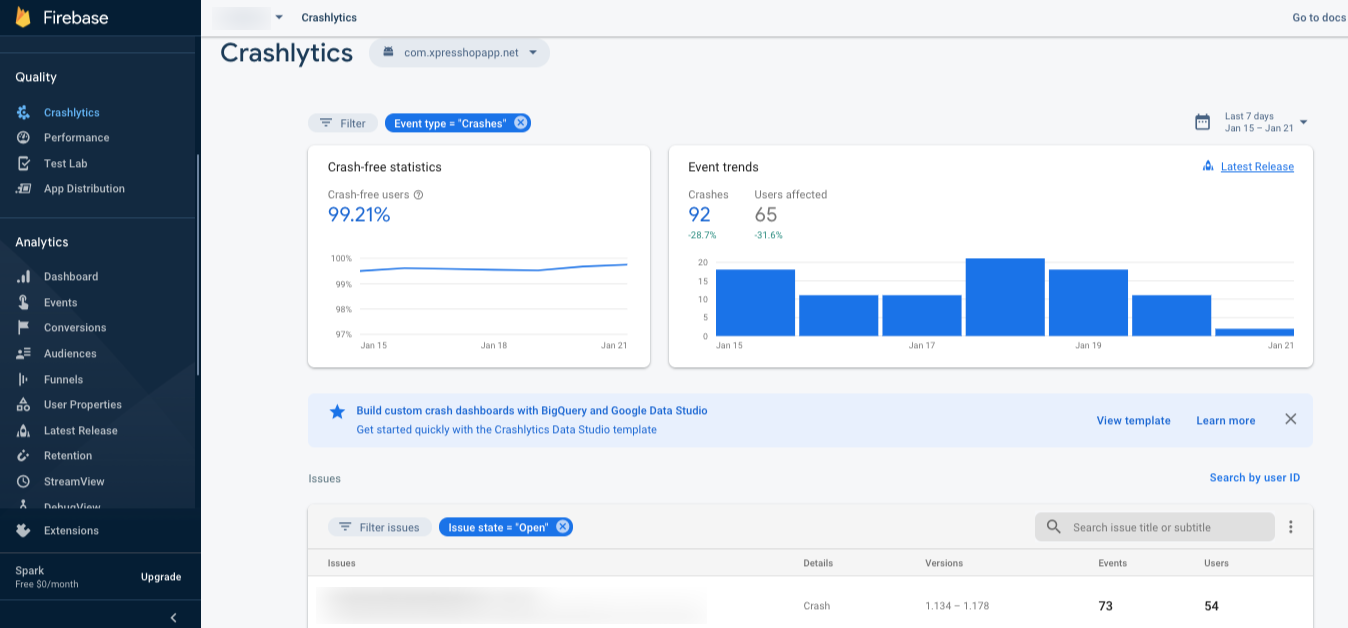
Crashlytics
Crashlytics in Firebase shows the stability of your app. In addition, it describes how many users have faced app crash and the code responsible for the crashing.
To sum up, with firebase, you are sure to shoot your business to a booming high. That is to say, all you have to do is to understand your audience and customer base and keep them inclined towards your product with enticing offers, notifications, and discounts.
Fortunately, firebase gives the advantage to implement your experiments using your audience as Guinea pigs and figuring out what is best for them.
Hope you have a fair idea from this guide to Firebase Analytics. Keep a check on our blogs to read more about Firebase in detail and other stories!


No Comments
Leave a comment Cancel